The Technology Extrapolation Domains (TEDs) Geospatial Framework can help improve decision making about fertilizer management tools and products. Learn how to harness the power of the TED Tool.
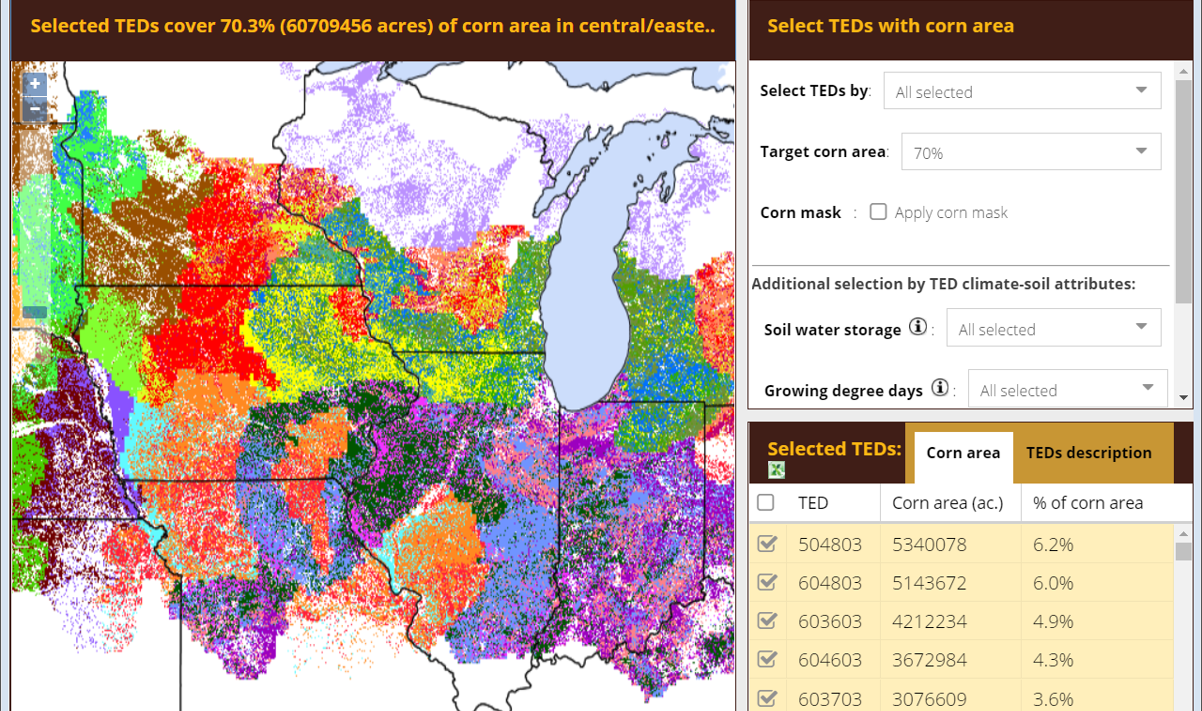
The TED Tool interface contains three distinct sections including a map display to the left, and two sections to the right. The section to the upper right allows the user to make various selections to change the information generated by the tool. Once selections are made, information will be displayed visually in the map section to the left and as text to the lower right. The user can zoom in on the map to see greater detail, sort the information in the text output display in the lower right, and also export that information as a spreadsheet.
*Note: click on screenshot images to enlarge.
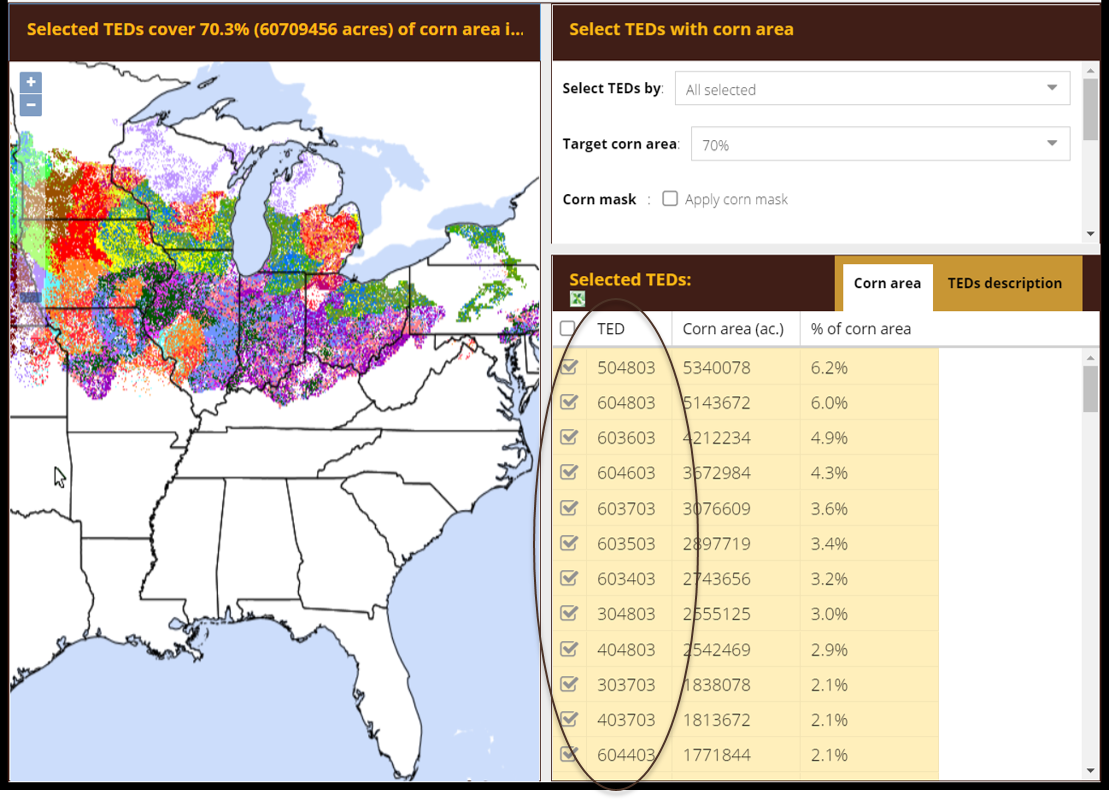
Each TED is represented by a different color and by a six-digit number. Note here how the six-digit TED numbers are displayed in the interface.
The colors that correspond to the TED numbers will change depending on how many TEDs are being displayed on the map. So, TEDs should always be referred to by their unique number, not by corresponding colors which are only assigned temporarily.
The unique six-digit TED numbers are derived from assigned soil and climatic parameters. TEDs are displayed at 250 x 250 meter pixel size.
We have associated a TED number with many of the product trial locations found on the NutrientStar website. You can then use the TED Tool to locate your own farm (i.e. with GPS coordinates) or general location (with the state or rectangle selection options) to see if the TED associated with a research trial of interest is found in your own location and/or region of interest.

What is “target corn area”? This selection allows you to change the percentage of TEDs visible according to their ranking in US corn production. For example, if you select a low percentage (i.e. 20%) for target corn area, this means you will only see TEDs covering the highest 20% of total corn production area in the US. As you increase the target corn area percentage selection (i.e. 70%), you add more TEDs (and thus more corn area), but each additional TED added has fewer and fewer corn acres associated with it.
Also note that the interface defaults to display 70% of “target corn area” because this allows the tool to load quickly while still displaying the preponderance of TEDs.

There are many ways to derive TEDs that may be of interest to you.
The most targeted way is to enter GPS coordinates.
For example, if you are a farmer, you might enter the coordinates for one of your fields to find out all TEDs associated with that site. Or if you are a crop advisor, you can enter coordinates for your clients’ fields. Note that the tool will output all TEDs within a 1-mile radius of the coordinates entered.
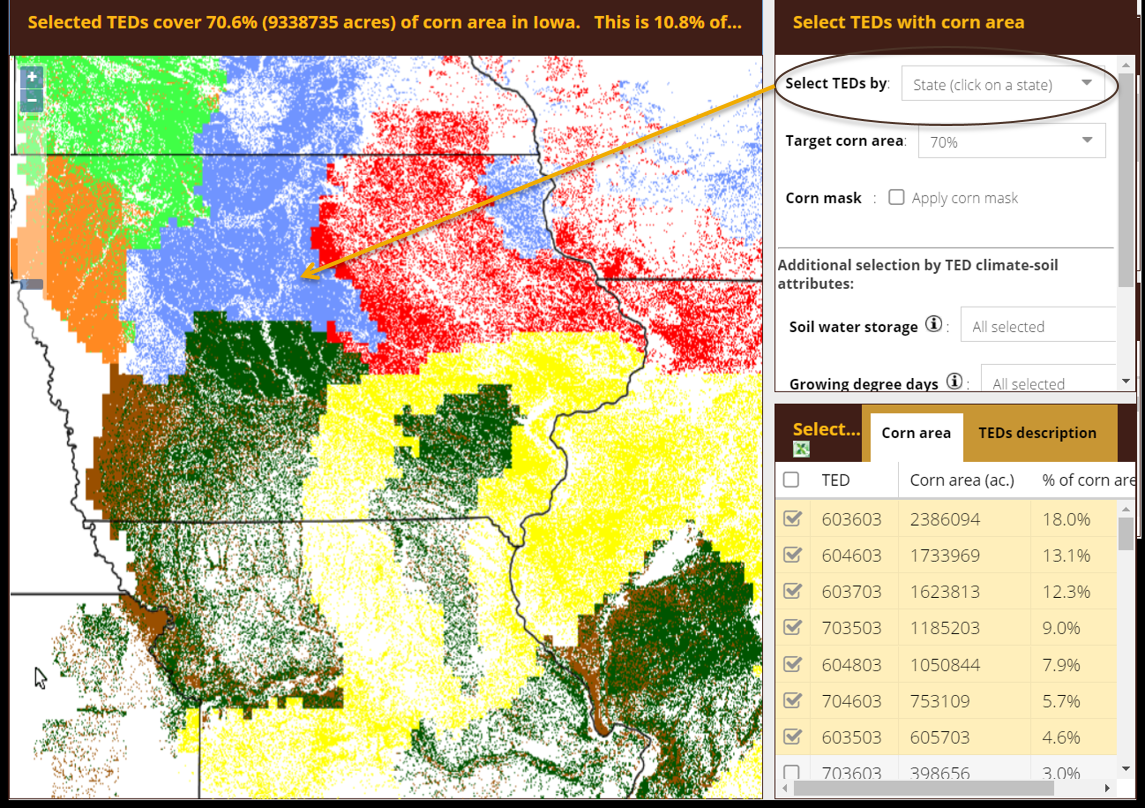
By selecting the “state” option in the “Select TEDs by” drop-down menu, you can click on any state to see the TEDs contained in that state.
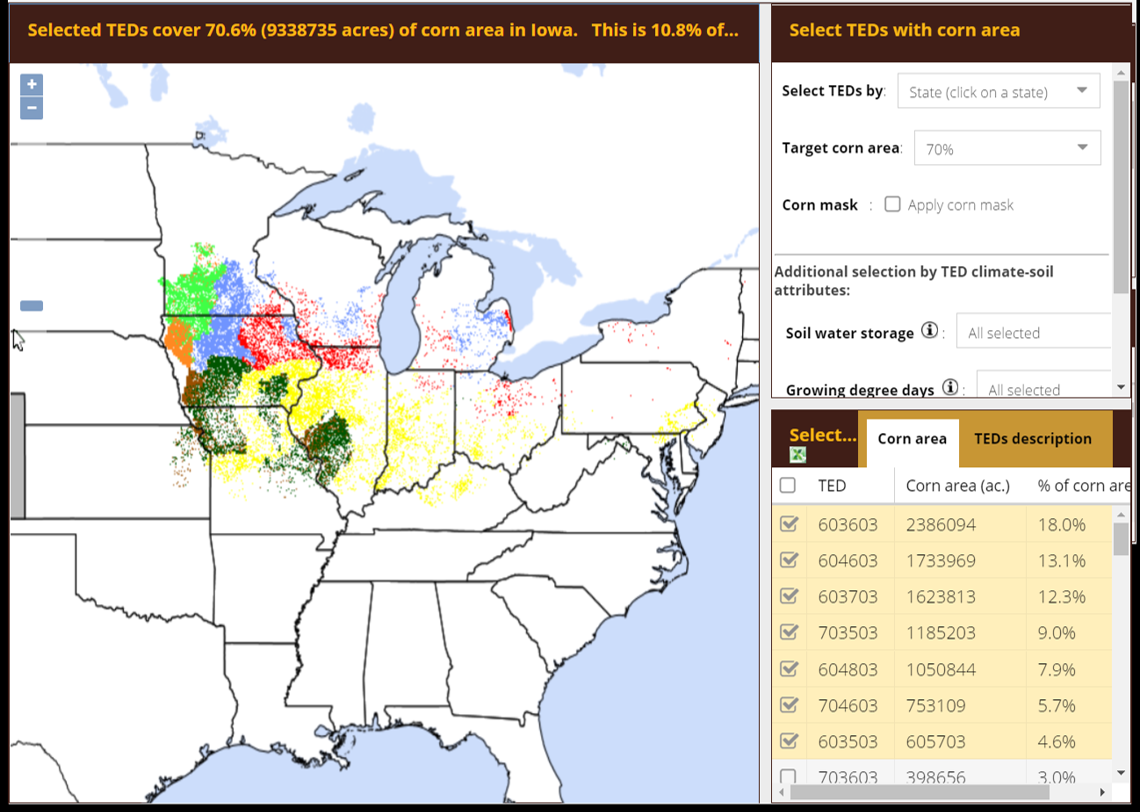
Note that after making a selection using the “state” option in the “Select TEDs by” drop down menu, you will also see how the TEDs from within the selected state extends to other states. This can be useful in understanding how and where climate and soil attributes in your state are similar in other states.
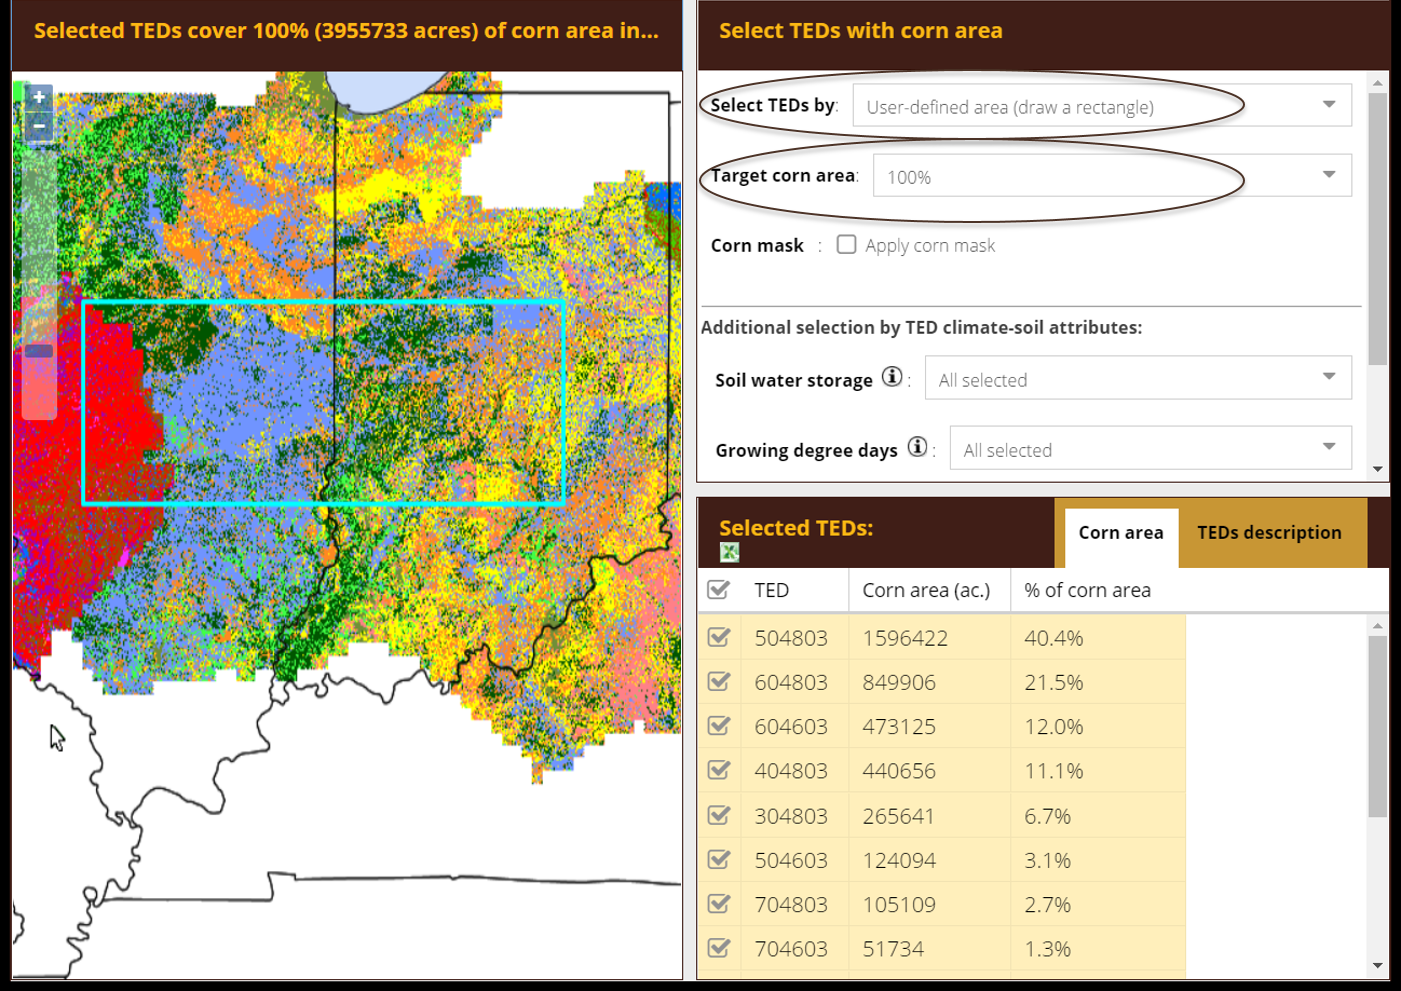
The tool allows you to draw a rectangle around an area of interest to derive all TEDs contained in that user-defined area.

The tool also allows you to make selections based on the following attributes: soil water storage, growing degree days, aridity index, and temperature seasonality. You can select one or multiple of these attributes in making your selection.

When making attribute selections, you can click on the corresponding information icon for a definition of that attribute.

Click on the Excel icon to download a spreadsheet of your results.