What is the Climate FieldView™ Nitrogen Management Tool?
The Nitrogen Management Tool is integrated with other Climate FieldView™ features, providing a unified platform for nutrient management, seeding, field insights, yield analytics and weather monitoring.
Climate FieldView™ yield analysis tools allow farmers to quickly compare yield patterns with other data layers at the end of the season, enabling them to determine how fertility and other agronomic decisions can impact yield.
Access
- Visit climate.com
- Contact Sales Support at support@climate.com or (888) 924-7475
- Contact your agronomy retailer
Data Inputs
- Field boundaries mapped from Climate FieldView™ or imported from an external source
- Nitrogen management program including product types and application information
- Seeding program information imported from planter or customer-entered
- Field history including previous crop, tillage system, and manure history
- Soil data, weather data, and field imagery data are automatically provided by Climate FieldView™ for every customer’s field. Additional soil test information may optionally be imported using Climate FieldView’s™ Data Inbox feature.
- Yield goals
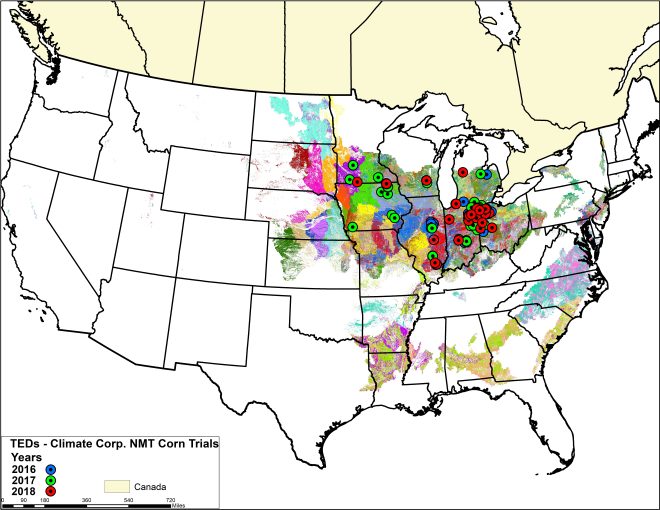
Most fields had 4 N treatment rates and 4 replicates per treatment. Application rates were approximately 100, 150, 200 and 250 pounds N/acre. Treatments were mostly applied at sidedress, either as UAN or anhydrous. Most fields also had a spring pre-plant application. Yield response to nitrogen was determined from the trial data (using a combination of quadratic and linear fit methods in accordance with NutrientStar procedures; see figure 2 for an example).
The commercially available version of Nitrogen Management Tool was used to estimate sidedress nitrogen application requirements in late Spring 2017 and 2018 for each specific field. Known weather was used up until the sidedress date, and forecasted weather was used for the remainder of the season, to mimic a user’s experience at sidedress time. Sidedress rates were adjusted to achieve a target N status of +15 lbs/ac (2016 and 2018) and +25 lbs/ac (2017). Yield goals were selected at the time of sidedress by consultants and growers managing field trials. Consultants and growers were advised to select yield goals corresponding to the fourth highest yield achieved by growers in the five years prior to the trial (i.e. the 80th percentile of achieved yield in the last five years).
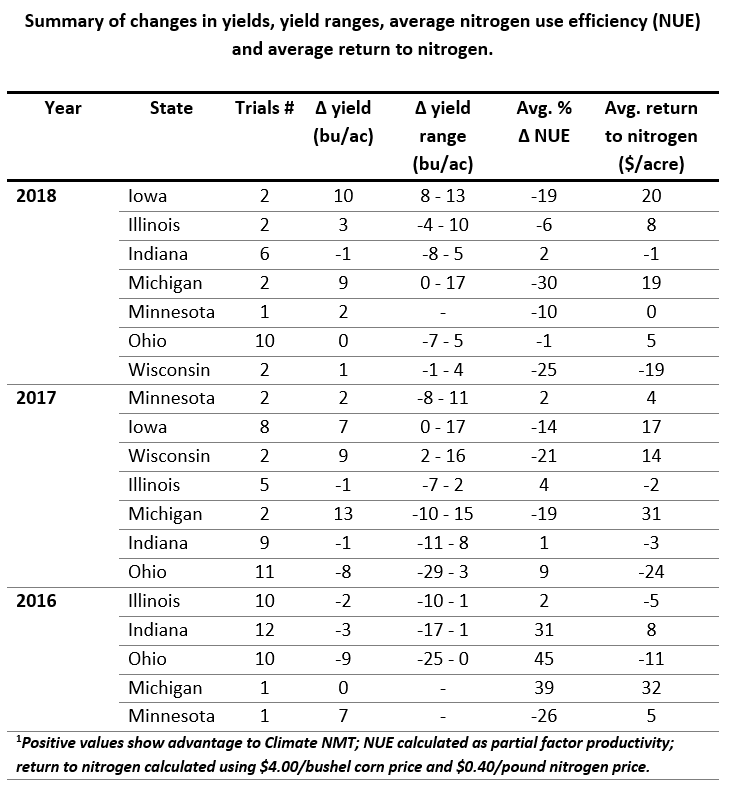
Grower-preferred nitrogen application rates (solicited from farmers of the trial fields in consultation with expert agronomists) and Nitrogen Management Tool-based rates were compared based on nitrogen costs, yield incomes, and net economic outcomes. Yields corresponding to the farmer and Nitrogen Management Tool chosen nitrogen rates were estimated using the yield response to nitrogen relationships described above, with the price of corn set to $4.00/bu and the price of nitrogen set to $0.40/lb.
Across all trials, Nitrogen Management Tool-based application rates resulted in no statistically significant change in return to nitrogen compared with grower rates (p > 0.95), and a 6% improvement in NUE, using farmer estimated yield goals.
To view a report of Climate Fieldview NMT trials conducted by NutrientStar in 2016, click here.
To view a report of Climate Fieldview NMT trials conducted by NutrientStar in 2017, click here.
To view a report of Climate Fieldview NMT trials conducted by NutrientStar in 2018, click here.